Sample Code:
while true
do
for pid in `cat pids`
do var=`date|cut -d’ ‘ -f4`
echo “$var :c” >> ps.log.$pid
ps -eo pid,vsz,rss,pcpu,args | grep $pid |grep -v grep >> ps.log.$pid
done
sleep 30
done
Deployment steps:
1.) Deploy this code as ksh file
2.) Create i/p file named as pids including all process ids
3.) The Script can be executed in the foreground or background as required to start the capture. For example:
./mem.ksh
./mem.ksh &
4.) script creates a log file for each process id listed in the pids file in the form:
ps.log.$pid
where $pid is the process id of the process whose data has been logged to the file.
In the example above, the script will capture data every 30 seconds. It is critical to monitor over a reasonable period of time. This reasonable period of time will highly depend upon the process being monitored and the specific scenario in question. Typically a reasonable timeframe will be somewhere in the realm of a few hours to letting it run overnight.
5.) To stop capturing performance data, simply stop the mem.ksh using either the Ctrl-C keys if it is running in the foreground, or the “kill -9” command if it is running in the background.
II. Reviewing Basic Performance Data
Once the performance data has been gathered, the next step is to review the results and confirm whether a memory leak is occurring. Typically it is easier to review the data in a spreadsheet application as it can be used to sort, filter and plot the data. The following is an example of how to review the shell script data to determine whether there is a memory leak using the Microsoft Excel program:
Below are series of screen shots for different steps:
1.) Depending on the number of process ids that were entered into the pids file above, you will have one or more performance log files to review. One for each process id. In this example, you are reviewing the data in the file ps.log.1004 which has been generated from the Solaris shell script.
2.) The data is still unformatted so highlight all the data then select Data > Filter > Auto filter. Then you can select the drop down box in the PID column C and select the PID that you are interested in, for this example 1004:
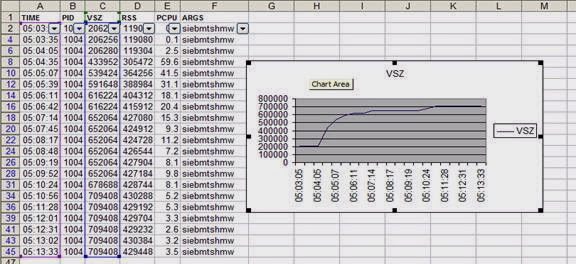
3.) You know the order of the column data is TIME, PID, VSZ, RSS, PCPU, and ARGS from the shell script. So insert a row at the top of the worksheet with these headings and delete any columns that you are not interested in:
4.) You can now use the data in the TIME and VSZ columns to graph the results.
5.) This generates a simple graph of memory usage (VSZ) versus time. As you can see the graph below shows that PID 1004 grows very rapidly from 200 MB to 700 MB:
6.) Assuming the process is a Siebel process you can then use the PID from the previous step to search the Enterprise server log to determine which Siebel component is leaking memory. In this example it is the Call Center Object Manager which appears to be leaking memory:
ServerLog ProcessCreate 1 2004-11-03 11:52:03 Created multithreaded server
process (OS pid = 1004) for Call Center Object Manager (ENU) with task id 21201
At this stage the following has been established:
· Whether there is a memory leak
· What process or processes may be leaking memory
· What the memory consumption of the process is and was throughout the monitoring period
· If the process is a Siebel process, you will know to which Siebel component it corresponds
@AskmeSiebel
Thanks for subscribing to SimplySiebel.


1 comment for “UNIX Shell Script to gather Siebel Server performance data”