I. Commands
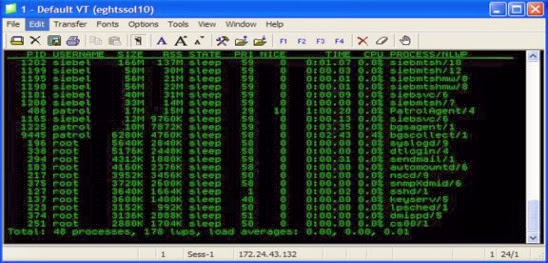
The prstat command can be used to gather basic performance data to help identify if there are any processes consuming a large amount of memory. For example, the data below is sorted by the SIZE column. SIZE is the total virtual memory size of the process:
prstat -s size
The data should be reviewed to see if there are any processes consuming an unusually large amount of memory. Generally if a Siebel Object Manager process (siebmtshmw) is using over 700 MB of virtual memory, then this is an indication that the process may have a memory leak.
II. Shell Script Output
If you suspect a memory leak on your system then you can use a shell script to gather detailed information for confirmation.
1.) Give all current Pids (output of above command) as input and run shell script.
2.) Extract data from log file
3.) Fed data in excel sheet and plot a graph b/w Time & VSZ
4.) Refer Review Performance data section for detail
The following data shows memory usage from data captured using a shell script for Sun Solaris:
1. Rapid Object Manager Memory Leak: The graph below shows a rapid Object Manager memory leak. From the graph, you can see that all of the data is for process id (PID) 11940. To get an appreciation of the memory growth you must review the TIME and VSZ columns. VSZ is the total size of the process in virtual memory. The siebmtshmw process starts up and grows to around 200 MB at which point memory growth rises sharply as the process’s memory usage increases to almost 2 GB in size.
2. Object Manager Memory Growth (No Leak): For comparison with the previous example, the graph below does not show an Object Manager memory leak. You can see that all of the data is for process id (PID) 5602. Again you need to review the TIME and VSZ columns for trends. In this case the siebmtshmw process starts up and rises to around 215 MB where it stays fluctuating only slightly. In this example the number of users remains constant over the period of the test and no memory leak was observed.
III. Enterprise Server Log Files
If the following errors are found in the Enterprise server log file that is located in the SIEBEL_ROOT/siebsrvr/enterprises/$Enterprise/$Siebel_server/log directory, then this indicates that a component has crashed:
SBL-OSD-02006 Process exited because it received signal SIGABRT
SBL-OSD-02011 Process exited because of a segment violation (SIGSEGV)
SBL-OSD-02010 Process exited because of a bus error (data alignment) SIGBUS
As an example, here is an extract from an Enterprise server log file:
ServerLog Startup 1 2004-03-10 14:26:21 Siebel Enterprise Applications Server is starting up
ServerLog ProcessCreate 1 2004-03-10 14:26:22 Created multithreaded server process (OS pid = 23845) for FINS Object Manager (ENU) with task id 50179
ServerLog ProcessExit 1 2004-03-10 14:36:46 FINSObjMgr_enu 50179 SBL-OSD-02006 Process exited with error – Process exited because it received signal SIGABRT
From the above entries, you can see that the FINS Object Manager had a OS process id (pid) of 23845, the component had a Siebel task id of 50179 and the crash happened at 2004-03-10 14:36:46.
IV. Core Dump Files
Core dumps are created on UNIX when a process crashes. The size of these core files can be useful in determining whether a memory leak has occurred. Core files can be large in size, since all the memory allocated to the process at the time of the crash is written to disk. For example, an Object Manager process that crashes while it is consuming 400 MB will create a core file that is 400 MB in size on the hard disk.
The size of a core file is a useful indication of whether there is a likely to be a memory leak.
IV. Additional Information
While gathering the performance data, it is also important to gather some additional information to help determine what activities are occurring on the Siebel server. It is recommended that the following information is collected at least every 15 minutes while the performance data is being captured:
1.) In the srvrmgr utility, run the following commands and save the results for review:
srvrmgr> spool /home/list_task_mmddyy_hhmm.txt
srvrmgr> list tasks for server <Name of Server>
srvrmgr> list sessions for server <Name of Server>
srvrmgr> spool off
2.) Stats.swe page information should be captured if you are investigating an Object Manager memory leak. In a web browser hit the stats.swe page for example:
http://<webserver>/callcenter_enu/_stats.swe?verbose=high
Save the output to an html file in the form of:
stats_<webserver_mmddyy_hhmm>.htm.
Thanks for subscribing to SimplySiebel.


